scQCEA
Introduction
This documentation gives an introduction and usage manual of scQCEA (acronym of the single-cell RNA sequencing Quality Control and Enrichment Analysis) an R package for annotation and quality control report of scRNA-Seq profiles. It generates an interactive report of quality control metrics which allows visual evaluation of QC metrics, objective selection of insightful optimal cluster numbers and discrimination between true variation and background noise.
The easiest way to generate an interactive summary QC report is to run the RUN_ME.R script from RStudio. The required inputs are a gene-cell count matrix, feature-barcode matrices, and tSNE and UMAP projections from 10X CellRanger count.
Easy Installation
- Install the R (LINK)
- Install the free version of rStudio (LINK)
- Run the following command in rStudio to install scQCEA as an R package: ```{r,eval=FALSE} if (!requireNamespace(“devtools”, quietly = TRUE)) install.packages(“devtools”)
library(devtools) devtools::install_github(“walkerke/bsselectR”) install_github(“isarnassiri/scQCEA”)
All dependency packages automatically will be downloaded, installed and loaded from CRAN-like repositories. The following versions of its dependencies are compatible with the library:

**Required version of packages in R:**

─ Session info ──────────────────────────────────────────────────────────────────────────────────
 version  R version 4.1.3 (2022-03-10)
 ui       RStudio
 language (EN)
 collate  en_GB.UTF-8
 ctype    en_GB.UTF-8
 rstudio  2022.02.1+461 Prairie Trillium (desktop)
 pandoc   2.17.1.1 @ /Applications/RStudio.app/Contents/MacOS/quarto/bin/ (via rmarkdown)

─ Packages ──────────────────────────────────────────────────────────────────────────────────────
 package              * version  date (UTC) lib source
 annotate             * 1.72.0   2021-10-26 [1] Bioconductor
 AnnotationDbi        * 1.56.2   2021-11-09 [1] Bioconductor
 AUCell               * 1.16.0   2021-10-26 [1] Bioconductor
 Biobase              * 2.54.0   2021-10-26 [1] Bioconductor
 BiocGenerics         * 0.40.0   2021-10-26 [1] Bioconductor
 BiocManager          * 1.30.17  2022-04-22 [1] CRAN (R 4.1.2)
 bsselectR            * 0.1.0    2022-04-18 [1] Github (walkerke/bsselectR@c196e8f)
 cluster              * 2.1.2    2021-04-17 [1] CRAN (R 4.1.3)
 data.table           * 1.14.2   2021-09-27 [1] CRAN (R 4.1.0)
 devtools             * 2.4.3    2021-11-30 [1] CRAN (R 4.1.0)
 DiagrammeR           * 1.0.9    2022-03-05 [1] CRAN (R 4.1.2)
 downloadthis         * 0.3.1    2022-02-23 [1] CRAN (R 4.1.2)
 dplyr                * 1.0.9    2022-04-28 [1] CRAN (R 4.1.2)
 DropletUtils         * 1.14.2   2022-01-09 [1] Bioconductor
 DT                   * 0.22     2022-03-28 [1] CRAN (R 4.1.2)
 GenomeInfoDb         * 1.30.1   2022-01-30 [1] Bioconductor
 GenomicRanges        * 1.46.1   2021-11-18 [1] Bioconductor
 GEOquery             * 2.62.2   2022-01-11 [1] Bioconductor
 ggplot2              * 3.3.6    2022-05-03 [1] CRAN (R 4.1.2)
 graph                * 1.72.0   2021-10-26 [1] Bioconductor
 GSEABase             * 1.56.0   2021-10-26 [1] Bioconductor
 IRanges              * 2.28.0   2021-10-26 [1] Bioconductor
 kableExtra           * 1.3.4    2021-02-20 [1] CRAN (R 4.1.0)
 Matrix               * 1.4-0    2021-12-08 [1] CRAN (R 4.1.3)
 MatrixGenerics       * 1.6.0    2021-10-26 [1] Bioconductor
 matrixStats          * 0.62.0   2022-04-19 [1] CRAN (R 4.1.2)
 NMF                  * 0.24.0   2022-03-29 [1] CRAN (R 4.1.2)
 pdftools             * 3.3.0    2022-07-07 [1] CRAN (R 4.1.2)
 pkgmaker             * 0.32.2   2020-10-20 [1] CRAN (R 4.1.0)
 plotly               * 4.10.0   2021-10-09 [1] CRAN (R 4.1.0)
 png                  * 0.1-7    2013-12-03 [1] CRAN (R 4.1.0)
 R.methodsS3          * 1.8.1    2020-08-26 [1] CRAN (R 4.1.0)
 R.oo                 * 1.24.0   2020-08-26 [1] CRAN (R 4.1.0)
 R.utils              * 2.11.0   2021-09-26 [1] CRAN (R 4.1.0)
 readr                * 2.1.2    2022-01-30 [1] CRAN (R 4.1.2)
 registry             * 0.5-1    2019-03-05 [1] CRAN (R 4.1.0)
 rmarkdown            * 2.13     2022-03-10 [1] CRAN (R 4.1.3)
 rngtools             * 1.5.2    2021-09-20 [1] CRAN (R 4.1.0)
 rstudioapi           * 0.13     2020-11-12 [1] CRAN (R 4.1.0)
 S4Vectors            * 0.32.4   2022-03-29 [1] Bioconductor
 SingleCellExperiment * 1.16.0   2021-10-26 [1] Bioconductor
 stringr              * 1.4.0    2019-02-10 [1] CRAN (R 4.1.0)
 SummarizedExperiment * 1.24.0   2021-10-26 [1] Bioconductor
 usethis              * 2.1.5    2021-12-09 [1] CRAN (R 4.1.0)
 XML                  * 3.99-0.9 2022-02-24 [1] CRAN (R 4.1.2)
 zip                  * 2.2.0    2021-05-31 [1] CRAN (R 4.1.0)

 [1] /Library/Frameworks/R.framework/Versions/4.1/Resources/library
─────────────────────────────────────────────────────────────────────────────────────────────────
Environment:
We only tested scQCEA in the R version 4.1.3 (2022-03-10) environment. You need to have root permission for this distribution, including the installation of any package.
Install from Source Code
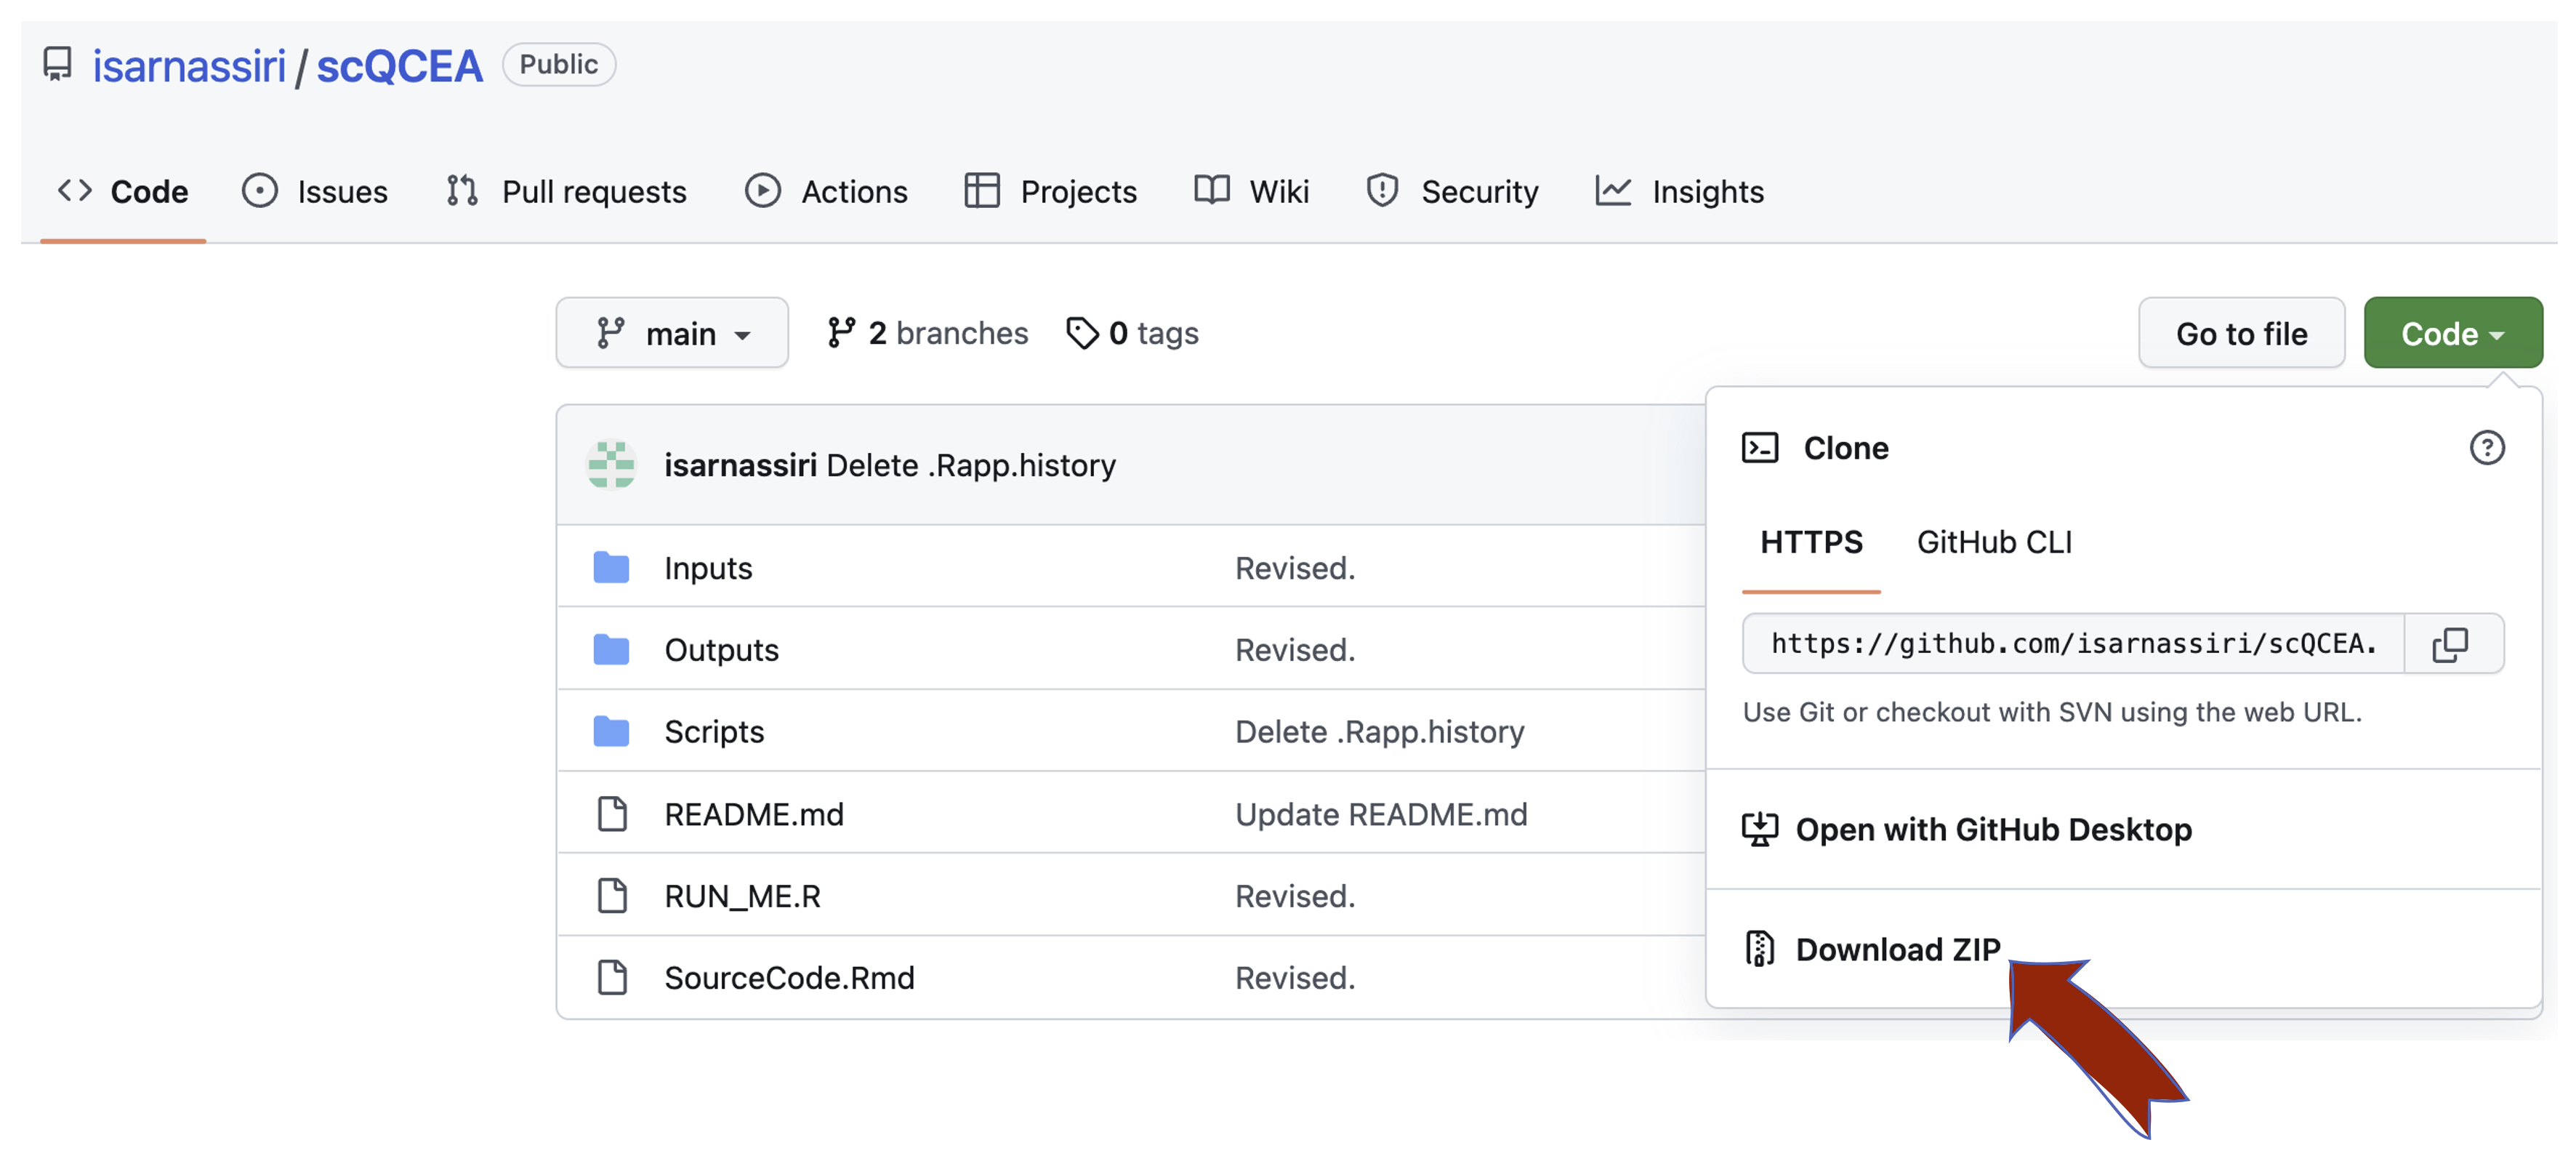
Alternatively, you can download the source codes and install libraries using the terminal.
 |
|---|
| Figure 1. How to download scQCEA from GitHub |
Manual
It is easy to create an interactive QC report for those who possess little or no programming language skills. To run and generate an interactive QC report on your computer please install and call the scQCEA using rStudio, select all scripts including the GenerateInteractiveQCReport() function, and click on the “Run” button at the top right of the Source tab. An interactive QC report automatically will be generated in one HTML file, including four sections: experimental workflow, data processing workflow, sample information and QC metrics, data analysis and quality control.
#########################################################################
# Please execute the code in the RStudio IDE (https://www.rstudio.com/) #
#########################################################################

library("scQCEA")
InputDir=system.file("extdata", package = "scQCEA")
GenerateInteractiveQCReport(InputDir)

############################################################
#  Find the "Interactive QC Report" in the Outputs/ folder #
############################################################
An interactive QC report automatically will be generated in one HTML file in the “Outputs/” folder, including four sections: experimental workflow, data processing workflow, sample information and QC metrics, data analysis and quality control (Figure 2).
 |
|---|
| Figure 2. The outline of scQCEA. See text for details |
Experimental workflow describes scRNA-seq transcriptome processing and sequencing platform. Data processing workflow presents an analysis pipeline to process data, including aligning reads, generating feature-barcode matrices, and other secondary analyses. Samples information and QC metrics provide tables of metadata and QC, listing a variety of metrics per application. Data analysis and quality control present projections of transcriptionally and functionally distinct clusters, highlighted by cell type group, including UMAP and t-SNE plots. Diagnostic plots provide technical features, including the distribution of non-duplicate reads with mapping quality per barcode.
By default, the HTML report will be written in the /Outputs directory named CLICK_ME.html. You can open CLICK_ME.html without using rStudio/R. In addition, you can find a zip file in the /Outputs directory which is particularly useful to share or store the QC reports. The content of the “Data processing Workflow” section is automatically adjusted based on the type of application (s) and the “Library Type” column in “samples.metadata” file.
Input Data
As input, the scQCEA package expects the following data:
- Metadata of samples (Figure 3) (samples.metadata)
 |
|---|
| Figure 3. Sample Metadata file |
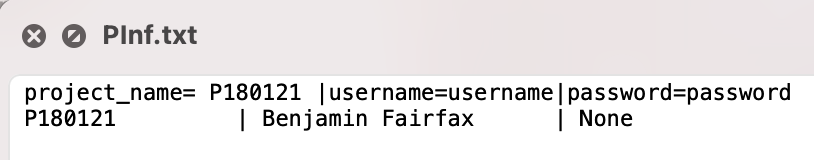
- Project Description (Figure 4) (PInf.txt)
 |
|---|
| Figure 4. Sample project description file |
- Output of 10X CellRanger or other single-cell experiments per pipeline (e.g. gex, ATAC, feat, etc.) [Note: you need to have at least one gene expression sample (gex)] (Figure 5)
 |
|---|
| Figure 5. Sample input files |
- scQCEA expects the following files in the outs/ subdirectory within each pipeline output directory (Figure 6):
 |
|---|
| Figure 6. Sample input files in outs/ subdirectories |
The genomics sample report in the metrics_summary.csv files includes a summary of the alignment and assignment of reads to cells and genes.
Raw count data from 10X CellRanger (outs/read_count.csv) or other single-cell experiments has the gene as a row (the gene name should be the human or mouse Ensembl gene ID) and the cell as a column. The tSNE and UMAP projections are the outputs of dimensionality reduction analysis in CSV format (projection.csv) (LINK).
If you have duplicated sample ID in the metadata.samples files, scQCEA assusmes you resequenced the same library to increase read depth. For this case, scQCEA generates a section in the interactive QC report, called GML (Grouped Multiple Libraries per sample) to visualise the QC measures. Please note that if you have several sequencing runs of the same library (e.g., increase read depth by resequencing the same library) you need to aggregate sequencing runs of the same library using cellranger count, and saved them in separate folder with ‘-grouped’ extention (e.g, 10X-gex-grouped).
You can find sample input files in the directory structure of the installed package using system.file("extdata", package = "scQCEA") command.
Cell Type Enrichment Analysis
Cell type annotation on scRNA-Seq data is a pre-step for generating an interactive QC report with scQCEA. This step requires some bioinformatics efforts, but scQCEA provides a function that comprises all the intermediate steps including visualization.
Recommended strategy for cell-type enrichment analysis:
scQCEA provides CellTypeEnrichment() functions, for cell-type enrichment analysis at the single-cell level that comprises all the intermediate steps including visualization. Function description, parameters and example input are as follows:
##### Cell Type Enrichment Analysis #####

library("scQCEA")

csQCEAdir <- system.file("extdata", package = "scQCEA")
# A directory path including input files/folders

DataTyep <- '10X-gex'
# Name of a folder including input files

SampleName <- '481207_03'
# Name of an indicated sample

SamplesMetadata = paste(csQCEAdir, 'Inputs/samples.metadata', sep = '/' )
# Metadata of samples including the following headers: Project Number,	LIMS ID,	Sample Name,	Index	Library Type,	Genome,	Flowcell ID,	Lane Number,	Sequencing ID

ReadCount = paste(csQCEAdir, 'Inputs', DataTyep, SampleName, 'outs', sep = '/')
# Gene-cell count matrix from 10X CellRanger count

GTF = paste(csQCEAdir, 'ensembl_human.txt', sep = '/')
# We convert Ensembl ids to gene names/symbols by parsing this GTF (General Transfer Format) file

BackendDataDir = paste(csQCEAdir, 'ReferenceGeneSets/', sep = '/')
# We used Human Protein Atlas database (version 21.0) to generate a repository of reference gene sets that are exclusively expressed in each cell type

tSNECellranger = paste(csQCEAdir, 'Inputs', DataTyep, SampleName, '/outs/analysis/tsne/gene_expression_2_components', sep = '/')
# tSNE projections from 10X CellRanger count

UMAPCellranger =  paste(csQCEAdir, 'Inputs', DataTyep, SampleName, '/outs/analysis/umap/gene_expression_2_components', sep = '/')
# UMAP projections from 10X CellRanger count

RawFeatureDir = paste(csQCEAdir, 'Inputs', DataTyep, SampleName, 'outs/raw_feature_bc_matrix', sep = '/')
# A folder including raw feature-barcode matrices from 10X CellRanger count (barcodes.tsv.gz, features.tsv.gz, matrix.mtx.gz)

FilteredFeatureBarcodes = paste(csQCEAdir, 'Inputs', DataTyep, SampleName, 'outs/filtered_feature_bc_matrix', sep = '/')
# A folder including raw feature-barcode matrices from 10X CellRanger count (barcodes.tsv.gz, features.tsv.gz, matrix.mtx.gz)

nCores = 1
# Number of cores to use for computation.

aucMaxRank = 250
# Number of expressed/detected genes that are going to be used to calculate the AUC. As a default, the first 250 genes are used to calculate the AUC.

CellTypeEnrichment(SampleName, SamplesMetadata, ReadCount, GTF, BackendDataDir, tSNECellranger, UMAPCellranger, RawFeatureDir, FilteredFeatureBarcodes, aucMaxRank = aucMaxRank, nCores = nCores )
The GenerateInteractiveQCReport() function uses these output files and generates an interactive QC report for multiple samples to compare and examine biases and outliers over biological and technical measures.
The function applies the area under the curve and bimodal distribution to separate the distributions and evaluate the strength of enrichment of each reference cell with genes in an indicated cell (Aibar, et al., 2017). Outputs of the CellTypeEnrichment function include visualization of transcriptionally and functionally distinct clusters, highlighted by cell type group using Uniform Manifold Approximation and Projection (UMAP) and t-stochastic neighbour embedding (t-SNE) plots. In addition, it generates Heatmap plots based on cells showing the most enriched expressed genes in each cell type group, and the Barcode Rank Plot showing the distribution of non-duplicate reads with mapping quality at least 30 per barcode and which barcodes were inferred to be associated with cells. The results can be used for the objective selection of insightful optimal cluster numbers and discriminate between true variation and background noise. For data sets including multiple samples, you can batch submit serial jobs for parallel execution of the CellTypeEnrichment function per sample on a High Performance Computing (HPC) system.
 |
|---|
| Figure 7. The outputs of the CellTypeEnrichment function. |
The GenerateInteractiveQCReport() function uses these output files and generates an interactive QC report for multiple samples to compare and examine biases and outliers over biological and technical measures.
Inputs for cell-type enrichment analysis:
The required inputs are a gene-cell count matrix (outs/read_count.csv), feature-barcode matrices (barcodes.tsv.gz, features.tsv.gz, matrix.mtx.gz) (LINK), tSNE and UMAP projections from 10X CellRanger count (analysis/…/projection.csv) (LINK), and a repository of reference gene sets.
We used Human Protein Atlas database (version 22.0) to generate a repository of reference gene sets that are exclusively expressed in each cell type (LINK). The normalized expression (NX) value was used to compare gene expression between tissues and select cell type-specific marker genes from RNA single-cell profiles. The repository includes 95 reference gene sets, and 2348 marker genes and is available at LINK. The repository of reference genes covers human and mouse genes with the possibility to expand them to other species.
More input options for cell-type enrichment analysis
Seurat Object:
You can transform the Seurat object to CSV format as follows:
library(data.table)
data_to_write_out <- as.data.frame(as.matrix(seuratObject@scale.data))
fwrite(x = data_to_write_out, row.names = TRUE, file = "read_count.csv")
HDF5 Feature-Barcode Matrix Format:
An HDF5 Feature-Barcode Matrix (LINK) can be converted to a gene-cell count matrix using the cellranger mat2csv (LINK) command provided by 10Xgenomics. The cells in the read_count.csv file are from the filtered feature-barcode matrix generated by the cell ranger.
Run Cell Type Enrichment Analysis for Multiple Samples
On an HPC Cluster: Create a tab-separated file (e.g., gex_aggregation) with input data set name (e.g., P220386), sample names (e.g., HAN9935A100), gene-cell count matrix paths (e.g., ~/P220386/10X-gex/HAN9935A100), the repository of reference gene sets path (e.g., ~/references/reference_gene_sets/human), and reference genome names (e.g., hsapiens) as follows:
P220386 HAN9935A100     ~/P220386/10X-gex/HAN9935A100    ~/references/reference_gene_sets/human   hsapiens
P220386 HAN9935A101     ~/P220386/10X-gex/HAN9935A101    ~/references/reference_gene_sets/human   hsapiens
P220386 HAN9935A102     ~/P220386/10X-gex/HAN9935A102    ~/references/reference_gene_sets/human   hsapiens
Use this file to submit enrichment analysis scripts in parallel on the HPC cluster using the CellTypeEnrichment_Multiple_Samples.sh script as follows:
NAMEFOLDER='P220386'
cd '~/'$NAMEFOLDER
FILE='gex_aggregation'
t=$(wc -l 'gex_aggregation')
qsub -t 1-${t%% *} CellTypeEnrichment_Multiple_Samples.sh $PWD'/gex_aggregation'
You need to copy the files available at LINK to the folder of inputs files. You need to modify lines 5-6, and 10 in CellTypeEnrichment_Multiple_Samples.sh depending on the set-up of the HPC.
On a Desktop Computer:
You can run the CellTypeEnrichment() function in a loop for multiple inputs. Create a tab-separated file as described above, read the tab-separated file (e.g., gex_aggregation) in R, and use elements in each row as input parameters of the CellTypeEnrichment() function.
Transfer QC metrics summary to the Inputs folder
Before running the GenerateInteractiveQCReport() function, you need to transfer the metrics_summary.csv and samples.metadata files to the Inputs/ folder. You can use the MetricsSummary.sh script to automatise transferring files for a scRNA-Seq project (e.g., P230078) as follows:
You need to copy the MetricsSummary.sh script available at LINK to the folder of inputs files and run it as follows:
#- copy MetricsSummary.sh script to the project folder:
cp ~/MetricsSummary.sh ~/P230078/

#- change your current directory to the project folder:
cd ~/P230078/

#- make MetricsSummary.sh script excutable
chmod u+x MetricsSummary.sh

#- run the  MetricsSummary.sh script
./MetricsSummary.sh -i P230078
Example of Application
To demonstrate the utility of scQCEA, we apply the workflow to the sixteen gene expression profiles of eight patients with metastatic melanoma, prepared from pre- and post-treatment experimental batches (Fairfax, et al., 2020). Download and unzip the OGC_Interactive_QC_Report_ P180121.zip file available at LINK. You can open the CLICK_ME.html file inside the unzipped folder without using rStudio/R.
The interactive report of quality control metrics and image QC of profiles allowed visual evaluation and comparison of comprehensive QC metrics. Top-ranking genes by expression in each cell illustrate similar cell types in samples, all associated with monocytes, t-cells, and related subsets. These results suggest that the cell type enrichment analysis captures the main clusters across cells and samples share similar cellular compositions in agreement with the original paper (Fairfax, et al., 2020).
History
Release v0.1.1 (04/07/2022) A completed version for all planned features.
Quick Resources
Latest version on GitHub (LINK)
Issue Reports
If you find any error or suspicious bug, we will appreciate your report. Please write them in the GitHub issues (LINK)
References
- Aibar, S., et al. SCENIC: single-cell regulatory network inference and clustering. Nature Methods 2017;14(11):1083-1086.
- Fairfax, B.P., et al. Peripheral CD8+ T cell characteristics associated with durable responses to immune checkpoint blockade in patients with metastatic melanoma. Nature Medicine 2020;26(2):193-199.
- Isar Nassiri, Benjamin Fairfax, Angela Lee, Yanxia Wu, David Buck, Paolo Piazza. scQCEA: A Framework for Annotation and Quality Control Report of Single-Cell RNA-Sequencing Data. BMC Genomics. 2023;07-06.